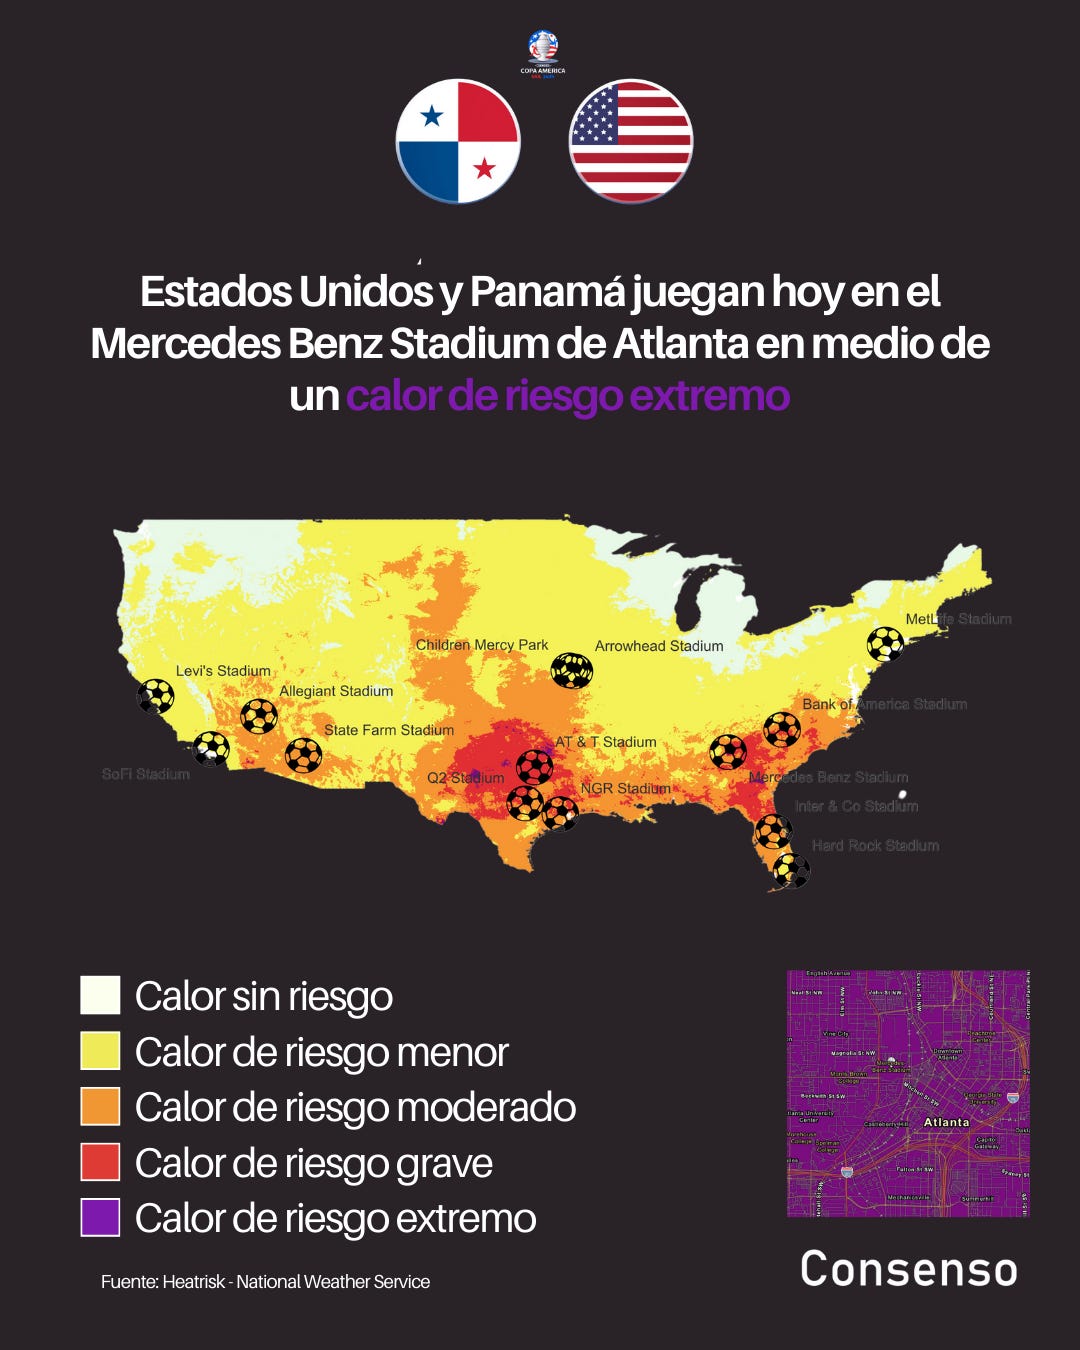
In the heat of the game: Maps shows the risk of extreme temperatures at the Copa America 2024 stadiums
Conmebol admitted the impact of extreme heat in the tournament. I show how bad could be.
Under normal conditions, humans have a cooling system installed in our bodies. It is called sweating.
But when a certain threshold of ambient temperatures is crossed (both in number of degrees and percentage of humidity) sweating costs more or is not enough.
In the United States, heat waves have worsened in intensity and extent. The start of a tournament in the American summer is in several of the states where the greatest risk of heat is predicted this weekend.
It is no coincidence that for the first time, CONMEBOL has published a series of medical recommendations to reduce the risk and impact of heat stroke for players during the Copa America 2024.
Among the measures set forth by Conmebol in response to the heat in the United States are medical examinations to identify athletes at risk, monitor the temperature and humidity percentage (through an index called "Wet-bulb Temperature") during matches and training sessions, allow breaks during matches for hydration and establish an emergency protocol for cramps, syncope, exhaustion and heat stroke.
The impact of heat on the world's oldest national teams tournament is an example of the challenges faced by mass sports in the face of a reality that they tend to ignore: climate change.
That is why Consenso created two tools to analyze the heat islands and temperature anomalies in all Copa America 2024 stadiums.
I did this by performing two analyses: one with heat risk databases from the National Weather Service of the United States for the week of June 21-27 and the other with the database of average temperature anomalies 2023 from the organization Trust for Public Land, plus additional data from Climate Central.
The result: an interactive map of the 14 stadiums showing average temperature anomalies in 2023.
An anomaly is an increase of land surface temperature because of the atmosferical conditions plus heat islands.
There you can see how the temperature increase worsens with the so-called heat islands - such as the parking lots of the stadiums, reaching an increase in the surface of 21 degrees Celsius compared to the average for the area.
One example is Arrowhead Stadium in Kansas, where the home team, the United States, will play on July 1 against Uruguay.
On the other hand, thanks to Weather.gov's HeatRisk tool, we can know the risk of heat impact on the days where the matches are played.
List of games (so far) with major heat risk:
Colombia vs Paraguay 06/24 NRG Stadium, Houston TX
Perú vs Canadá 06/25 Children Mercy Park, Kansas - where a referee collapsed by heatstroke.
Venezuela vs Jamaica el 06/30 Q2 Stadium, Austin, Texas.
Paraguay vs Costa Rica 07/02 Q2 Stadium, Austin, Texas.
Brasil vs Colombia 07/02 Levi’s Stadium, San Francisco, California.
Argentina vs Canadá 07/09 MetLife Stadium de Nueva Jersey.
Colombia vs Uruguay 07/10 Bank of America Stadium, Carolina del Norte.
Canadá vs Uruguay 07/13 Bank of America Stadium, Carolina del Norte
List of games (so far) with extreme heat risk:
Panamá vs USA 06/27, Mercedes Benz Stadium, Atlanta.
The relationship between climate and football is a complicated one. In the next chapter of this project, I will be explaining how the same teams affected by extreme heat help oil and gas companies to sportwash their brands.
This project is open to collaborations to improve the usability of the tools (for example, all heat risk maps are currently handmade with QGIS).
I will be updating this post with any changes related to the interactive map!


